 |
 |
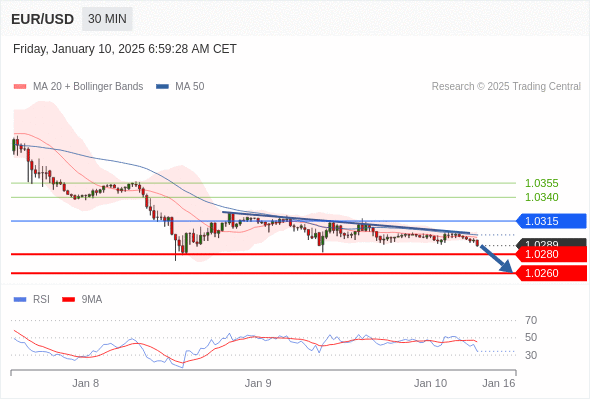
| EUR/USD Intraday: watch 1.0280. | Next |
| Pivot: 1.0315
Our preference: short positions below 1.0315 with targets at 1.0280 & 1.0260 in extension.
Alternative scenario: above 1.0315 look for further upside with 1.0340 & 1.0355 as targets.
Comment: a break below 1.0280 would trigger a drop towards 1.0260.
|  | | Green Lines Represent Resistances | Red Lines Represent Support Levels | Light Blue is a Pivot Point | Black represents the price when the report was produced |  |
|
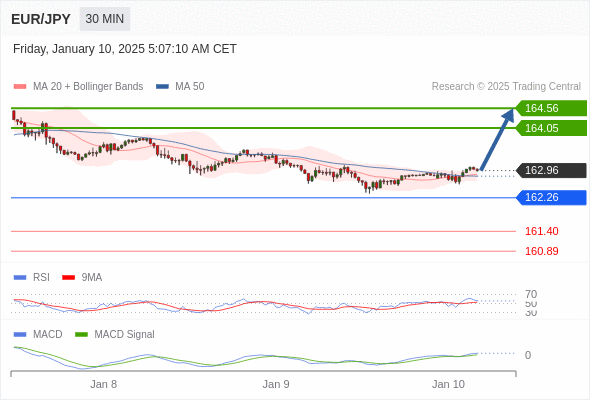
| EUR/JPY intraday: the upside prevails as long as 162.26 is support | Previous | Next |
| 162.26 is our pivot point.
Our preference: the upside prevails as long as 162.26 is support.
Alternative scenario: below 162.26, expect 161.40 and 160.89.
Comment: the RSI is above its neutrality area at 50. The MACD is positive and above its signal line. The configuration is positive. Moreover, the price is above its 20 and 50 period moving average (respectively at 162.86 and 162.82).
|  | | Green Lines Represent Resistances | Red Lines Represent Support Levels | Light Blue is a Pivot Point | Black represents the price when the report was produced | |
|
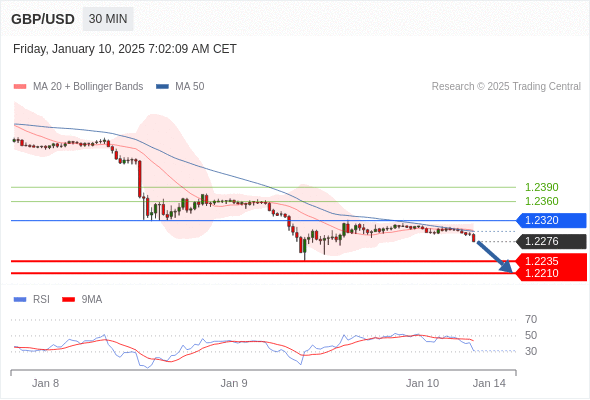
| Pivot: 1.2320
Our preference: short positions below 1.2320 with targets at 1.2235 & 1.2210 in extension.
Alternative scenario: above 1.2320 look for further upside with 1.2360 & 1.2390 as targets.
Comment: the upward potential is likely to be limited by the resistance at 1.2320.
|  | | Green Lines Represent Resistances | Red Lines Represent Support Levels | Light Blue is a Pivot Point | Black represents the price when the report was produced | |
|
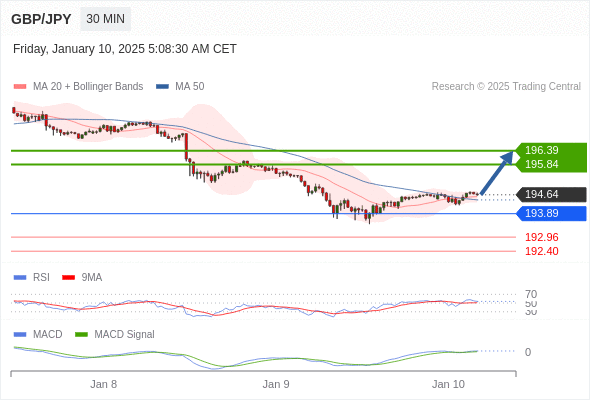
| GBP/JPY intraday: the upside prevails as long as 193.89 is support | Previous | Next |
| Our pivot point stands at 193.89.
Our preference: the upside prevails as long as 193.89 is support.
Alternative scenario: below 193.89, expect 192.96 and 192.40.
Comment: the RSI is above 50. The MACD is positive and above its signal line. The configuration is positive. Moreover, the price is above its 20 and 50 period moving average (respectively at 194.57 and 194.44).
|  | | Green Lines Represent Resistances | Red Lines Represent Support Levels | Light Blue is a Pivot Point | Black represents the price when the report was produced | |
|
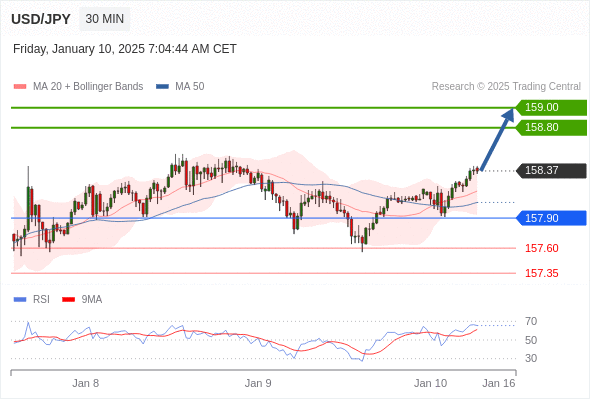
| USD/JPY Intraday: continuation of the rebound. | Previous | Next |
| Pivot: 157.90
Our preference: long positions above 157.90 with targets at 158.80 & 159.00 in extension.
Alternative scenario: below 157.90 look for further downside with 157.60 & 157.35 as targets.
Comment: the RSI calls for a rebound.
|  | | Green Lines Represent Resistances | Red Lines Represent Support Levels | Light Blue is a Pivot Point | Black represents the price when the report was produced | |
|
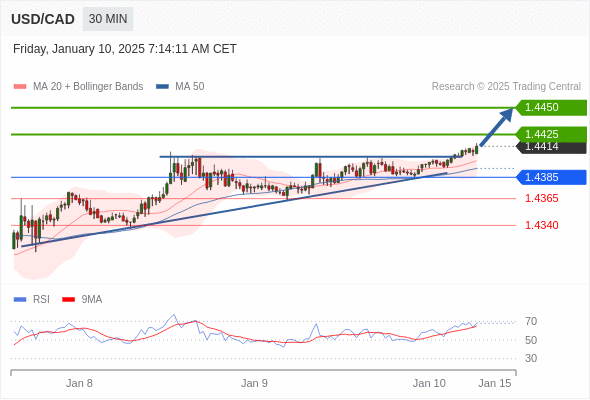
| Pivot: 1.4385
Our preference: long positions above 1.4385 with targets at 1.4425 & 1.4450 in extension.
Alternative scenario: below 1.4385 look for further downside with 1.4365 & 1.4340 as targets.
Comment: the RSI is bullish and calls for further advance.
|  | | Green Lines Represent Resistances | Red Lines Represent Support Levels | Light Blue is a Pivot Point | Black represents the price when the report was produced | |
|
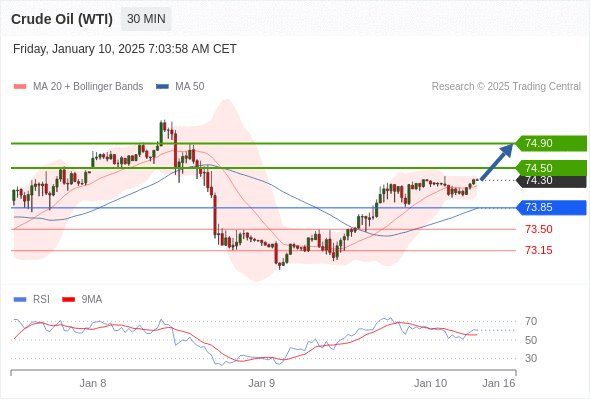
| Pivot: 73.85
Our preference: long positions above 73.85 with targets at 74.50 & 74.90 in extension.
Alternative scenario: below 73.85 look for further downside with 73.50 & 73.15 as targets.
Comment: the RSI is bullish and calls for further upside.
|  | | Green Lines Represent Resistances | Red Lines Represent Support Levels | Light Blue is a Pivot Point | Black represents the price when the report was produced | |
|
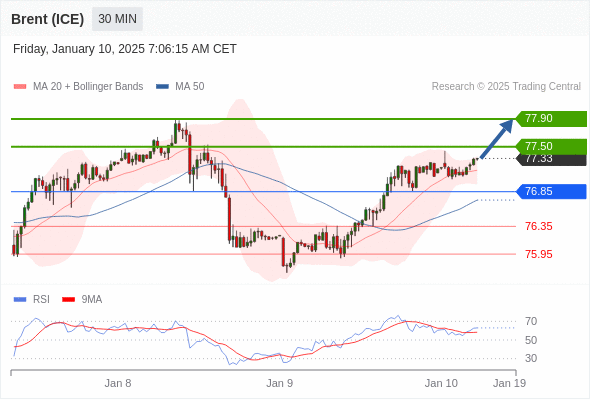
| Pivot: 76.85
Our preference: long positions above 76.85 with targets at 77.50 & 77.90 in extension.
Alternative scenario: below 76.85 look for further downside with 76.35 & 75.95 as targets.
Comment: the RSI is bullish and calls for further upside.
|  | | Green Lines Represent Resistances | Red Lines Represent Support Levels | Light Blue is a Pivot Point | Black represents the price when the report was produced | |
|
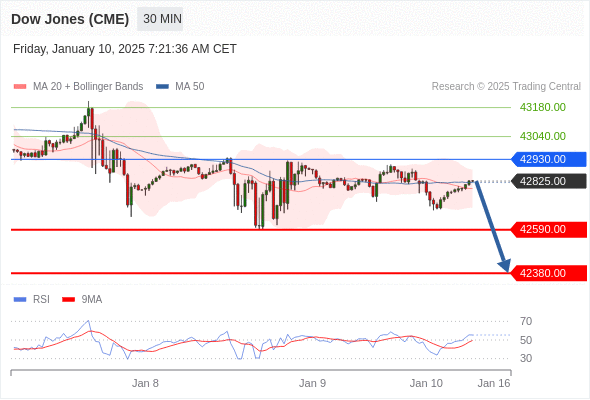
| Dow Jones (CME) (H5) Intraday: key resistance at 42930.00. | Previous | Next |
| Pivot: 42930.00
Our preference: short positions below 42930.00 with targets at 42590.00 & 42380.00 in extension.
Alternative scenario: above 42930.00 look for further upside with 43040.00 & 43180.00 as targets.
Comment: the RSI is mixed to bearish.
|  | | Green Lines Represent Resistances | Red Lines Represent Support Levels | Light Blue is a Pivot Point | Black represents the price when the report was produced | |
|
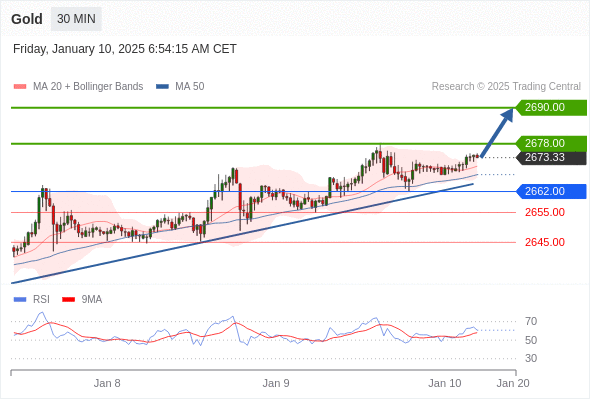
| Gold Intraday: intraday support around 2662.00. | Previous |
| Pivot: 2662.00
Our preference: long positions above 2662.00 with targets at 2678.00 & 2690.00 in extension.
Alternative scenario: below 2662.00 look for further downside with 2655.00 & 2645.00 as targets.
Comment: the RSI is around its neutrality area at 50%
|  | | Green Lines Represent Resistances | Red Lines Represent Support Levels | Light Blue is a Pivot Point | Black represents the price when the report was produced | |
|
|
 |  | | -------------------------------------------------------------------------------------------------------------------------------------------------------- |
Disclaimer TRADING CENTRAL is an independent third party research provider and the information provided should not be considered as trading advice. ICM Capital provides TRADING CENTRAL research to support clients in their trades and give them trading ideas, which should be independently evaluated. ICM Capital cannot be held liable for any information provided by TRADING CENTRAL. ICM Capital Ltd is a company registered in England and Wales under registered number: 07101360. ICM Capital Limited is authorised and regulated by the Financial Conduct Authority (FCA) regulatory number: 520965. Registered address: Level 30, 122 Leadenhall Street, London EC3V 4AB, United Kingdom | CFDs and Spot FX are complex instruments and come with a high risk of losing money rapidly due to leverage. Your profit and loss will vary according to the extent of the fluctuations in the price of the underlying markets on which the trade is based.
TRADING CENTRAL Terms and conditions
The information provided does not constitute, in any way, a solicitation or inducement to buy or sell securities and similar products. Comments and analysis reflect the views of TRADING CENTRAL at any given time and are subject to change at any time. Moreover, they can not constitute a commitment or guarantee on the part of TRADING CENTRAL. The recipient acknowledges and agrees that by their very nature any investment in a financial instrument is of a random nature and therefore any such investment constitutes a risky investment for which the recipient is solely responsible. It is specified that the past performance of a financial product does not prejudge in any way their future performance. The foreign exchange market and financial derivatives such as futures, CFDs (Contracts for Difference), warrants, turbos or certificates involve a high degree of risk. They require a good level of financial knowledge and experience. TRADING CENTRAL recommends the consultation of a financial professional who would have a perfect knowledge of the financial and patrimonial situation of the recipient of this message and would be able to verify that the financial products mentioned are adapted to the said situation and the financial objectives pursued. TRADING CENTRAL recommends reading the "risk factors" section of the prospectus for any financial product mentioned.
Head of Research at TRADING CENTRAL: Rémy GAUSSENS
TRADING CENTRAL is governed by the code of conduct of the association ANACOFI-CIF, association approved by the Financial Markets Authority and registered with ORIAS under number 17005458.
In the United States, TRADING CENTRAL AMERICAS, INC. is a Registered Investment Adviser (RIA) with the U.S. Securities and Exchange Commission (SEC) under IARD/CRD number 801-67210. Services are provided in the United States by TRADING Central Americas, Inc. TRADING Central will provide a copy of its most recent written disclosure statement without charge upon written request. Notwithstanding the foregoing paragraphs, nothing herein shall constitute a waiver or limitation of any U.S. person's rights under relevant U.S. federal or state laws.
In Asia, TRADING CENTRAL ASIA LTD has received a license (number AWI815) from the Hong Kong-based Securities and Futures Commission (SFC) to conduct “Type 4” and “Type 5” regulated activities (Advising on Securities and Futures).
TRADING CENTRAL recommends that you read the legal and regulatory information and warnings about the information provided by visiting the following link : terms_of_use_web_sites_en.pdf
Headquarters of the publisher : TRADING CENTRAL SA, 11 bis rue Scribe, 75009 Paris
RCS : PARIS B 423 512 607 VAT N° FR 174 235 12607 |
|
|
|